Introduction
Finding consistently winning bets just got easier. Are you tired of manually researching historical player and team performance across dozens of apps and websites? The Trends dashboard puts comprehensive historical betting data at your fingertips, helping you identify patterns and make more informed decisions based on historical win rates. Here’s how to use it effectively:
Step 1: Browse Trending Bets
The main dashboard displays a curated list of bets that have shown consistently high win rates. Each row shows you:
- The game and specific bet
- Best available odds and which sportsbook offers them
- Current winning streak (the number of games this bet has won in a row)
- Win rates over the last 5, 10, 15, and 20 games
Step 2: Analyze Historical Performance
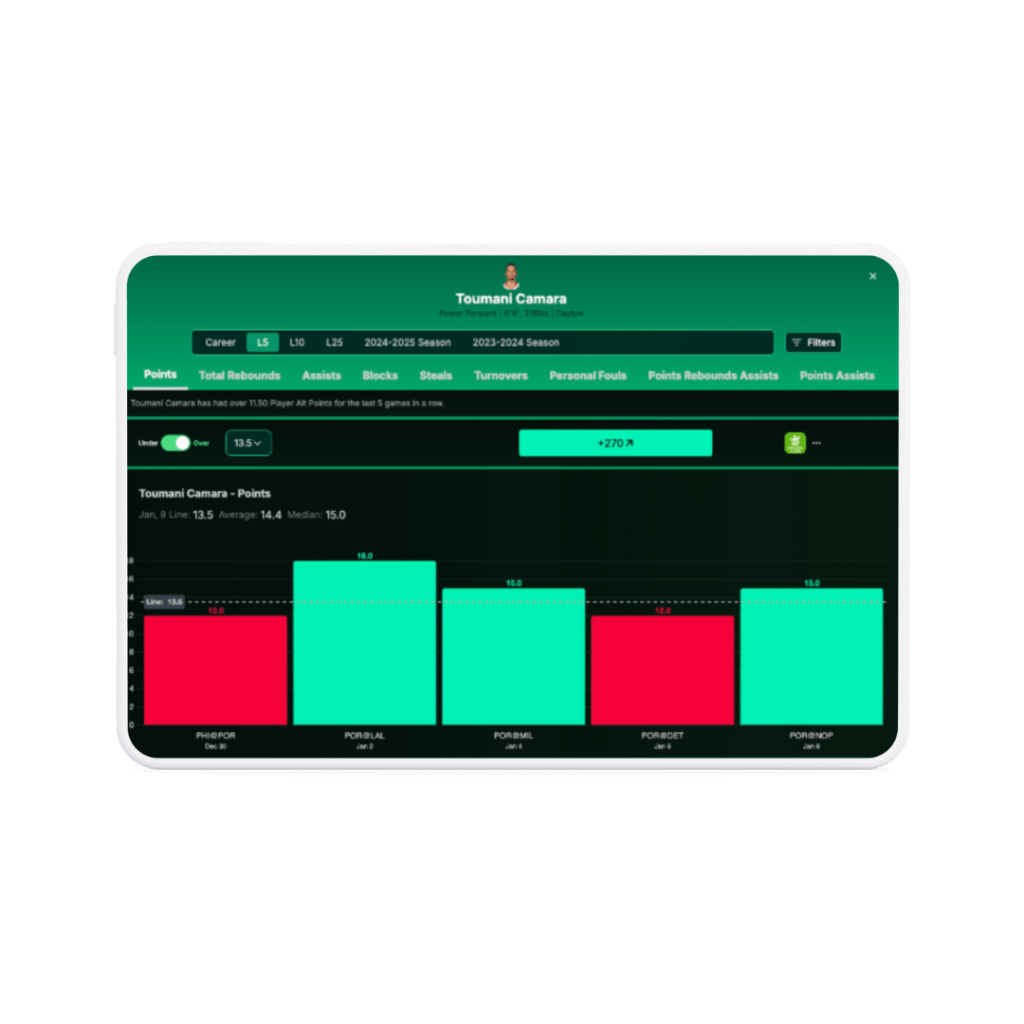
Click any row to dive deeper into the bet’s historical performance. The Analyze view opens to show:
- Detailed performance data visualized in bar charts
- Game-by-game results across different time periods
- Clear visual patterns of performance consistency
Step 3: Review Supporting Statistics
Scroll down to explore relevant supporting stats that might influence the bet’s outcome. For an NBA player total points prop bet, you’ll see key metrics like:
- Field goal attempts and percentages
- Three-point shooting stats
- Free throws attempted
- Free throw percentage
- Minutes played
- Offensive rebounds, etc.
All displayed in easy-to-read bar chart format.
Step 4: Consider Team Context
Check the injury report to understand how player absences might affect the bet. The dashboard lets you:
- View current team injury status
- Filter historical results to exclude games where key teammates were missing
- Analyze performance patterns with specific lineup combinations
Step 5: Make an Informed Decision
With all the historical data and supporting statistics in one view, you can quickly:
- Validate betting patterns
- Understand performance consistency
- Identify potential factors that might affect the outcome
- Build conviction in your betting decision
That’s it! The Trends dashboard transforms hours of research into a few simple clicks, giving you a comprehensive view of historical performance to support your betting decisions.

Leave a comment